Background
Color analysis is any technique by which an unknown color is evaluated in terms of known colors. Color analysis is widely used in scientific studies involving the appearance of objects and lights, and is of great importance for the analysis of raw materials and finished products of industry. Color Analysis is also important for monitoring process liquids and as a measurement of water quality for distribution or discharge. Color in water or wastewater may result from the presence of metals, organic acids, microbiological matter and/or industrial wastes.
Transmissive color analysis is characterized by the technique of measuring light that has passed through a partially opaque sample (as opposed to reflective analysis which measures light that is reflected from the surface of a solid sample).Color in partially opaque or transparent liquids is determined by the process of measuring and comparing light transmitted through a sample with light that has been transmitted through a color standard, such as a glass disk or an opaque standard solution.
Apparent vs True Color
In a liquid, turbidity in the form of colloidal matter or suspended particulates can scatter the light transmitted through the liquid in a way that alters the observed color. If a color measurement is made without first removing the colloidal or suspended sources of turbidity, the resulting measurement is known as apparent color. True color is the measurement made following the removal of colloidal or suspended sources of turbidity. The color of liquids is also a pH dependent, increasing in color with increased pH, which may require pH measurement or buffering.
Turbidity Removal
There are a variety of techniques used by laboratories to remove turbidity prior to sample analysis, including filtration through filter paper, centrifugation and other techniques. Some of these techniques were originally developed to extract solids for analysis. If these techniques are used for color analysis sample preparation, they may actually alter true color in the sample by exposing the sample to dyes and bleaches used to process the filter media.
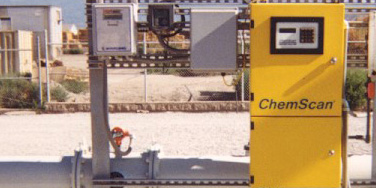
ChemScan recommends that particulates and colloidal material be removed from samples using a 0.1 micron pore size ultrafilter membrane. This membrane will reject all particles and colloids capable of scattering light and will also reject most microbial matter. The ChemScan Cross Flow filter has been specifically designed to perform this work in turbid surface water, domestic and industrial wastewater and in industrial process liquids.
Sunlight
Pure white light such as sunlight actually contains all of the colors of the spectrum. Each component color is refracted differently when passing from one medium into another medium with a different refractive index. This is why sunlight is separated into the color spectrum when passing through a prism. A complimentary refraction occurs if the light passes back to the original medium.
Transmitted vs Reflected Light
Transmissive colored substances are neither fully transparent (transmitting all colors of light) or fully opaque (transmitting none of them). Instead, transmissive colored substances are transparent to some colors and opaque to others. The object passes or reflects some colors and absorbs others, deriving the observed (by the eye) color from the fractions that have not been absorbed. Thus, a relatively transparent liquid will absorb some components of white light, while allowing other components to pass through. Detection is performed directly through the liquid, with the light source and detector arranged in a straight line. A relatively opaque or solid object with color will also absorb some fraction of white light, while reflecting other fractions. Refractive measurement is made at an angle, with different results obtained at different angles. ChemScan is designed for the analysis of transmissive liquids and relies on the percent of light transmission at numerous wavelengths for analysis.
Physical vs Physiological color
Light that is colored by transmission through a colored media or reflected from a colored surface may not contain the exact physical color corresponding to the physiological color that we observe with our eyes. Physical color can be measured by one of the techniques discussed below. The eye detects color through three types of color sensitive retinal cells, reacting to red, green and blue, with the brain combining these individual sensations to interpret color. An object that consists of two individual physical colors (such as red and yellow) will be perceived physiologically to be a combined color (orange). Therefore, color measured by physical means may show the responses from individual color components, while the eye will see the physiological results from the combination of the individual color components.
Color Measurement Terminology
The true color of a transmissive sample is the color measured in the sample after the turbidity from suspended or colloidal matter has been removed through filtration or other liquid-solid separation processes. We refer to this as a filtered sample.The color of a filtered sample can be expressed in terms of three values: The hue is designated by the term “dominant wavelength,” the degree of brightness is designated by the term “luminance,” and the saturation (pale, pastel, etc.) is designated by the term “purity.”
The relationship between dominant wavelengths and hue is shown below: Wavelength range (nm) Hue 400-465 Violet 465-482 Blue 482-497 Blue-green 497-530 Green 530-575 Greenish-yellow 575-580 Yellow 580-587 Yellowish-orange 587-598 Orange 598-620 Orange-red 620-700 Red
Color Measurement Methods
Platinum-Cobalt (Pt-Co) Methods. The platinum-cobalt method (EPA Method 110.2 and Standard Method 2120B) is useful for comparing the color of potable water and of water in which color is due to naturally occurring materials such as organic acids from leaves, bark, roots, humus and peat materials. This method is not applicable to most highly colored industrial wastewaters. This method was originally intended for visual comparison by matching sample color with calibrated glass slides or with standards made from dilutions of potassium chloroplatinate and cobaltous chloride in distilled water. These same Pt-Co standard solutions can be used to establish a calibration algorithm for the ChemScan Process Analyzer with wavelengths above, below and including the dominant yellow wavelength used for automatic analysis. Visual or comparative color analysis methods are sometimes referred to as hazen methods, after an early pioneer in the field of color analysis.
Tristimulus Methods
The most recognized tristimulus method is the CIE method, which provides three color values which, when combined, are in approximate agreement with average visual judgements of color appearance (not everyone “sees” color the same way.) Traditional CIE methods are intended for use in measuring the surface color appearance of solid or opaque substances and are, therefore based on reflectance factors, which are not directly applicable to the analysis of transparent or partially opaque liquids. However, the CIE and other tristimulus methods share a system to quantitatively approximate physiological color mixing. A convenient diagram for mixing colors is a chromaticity diagram, shown in Figure 1. The wavelengths of the spectral colors are listed around the perimeter. Any point not on the perimeter but within the diagram represents some additive mixture of colors. (This includes white, which is located within a bound area near the center of the diagram.) The advantage of this diagram is that it describes a systematic way to describe color mathematically.
The tristimulus filter method (Standard Method 2120D) is based on the measurement of percent transmittance at three specific wavelengths (590, 540, and 438nm). Luminance plus three tristimulus values are calculated directly from percentage transmittance values at the three wavelengths. The ChemScan Process Analyzer can directly detect these measurements and apply a special analysis algorithm to identify points on the chromaticity diagram. Results can be reported in terms of dominant wavelength (hue wavelength), percent luminance and percent purity. Or values can be converted to an ADMI single number color difference (EPA method 110.1 and Standard Method 2120E) using the Adams-Nickerson Color Difference (DE) calculation. Differences between sample measurements and standards can also be made using APHA color values.
Spectrophometric Methods
The most accurate method for color analysis is the spectrophotometric method (EPA Method 110.3 and Standard Method 2120C). This is the method of choice for domestic and industrial wastewaters, for industrial process liquids and for water analysis with complex and varied color components. This method requires analysis at a large number of wavelengths (90) and an instrument such as the ChemScan Process Analyzer, which is capable of being periodically zeroed by comparison to a fully transmissive zero standard such as deionized water.
In a manner similar to tristimulus methods, three coefficients are calculated from percent transmittance measurements. Each coefficient requires measurement at 30 specific wavelengths. Special analysis algorithms are used to locate chromaticity points and report results in terms of dominant wavelength (hue wavelength), percent luminance and percent purity.
Category Post
- All(-)
- DOCUMENT(4)
- NEWS(84)
- BUSINESS NEWS(19)
- COMPANY NEWS(23)
- SPECIALIZED NEWS(60)
Post latest
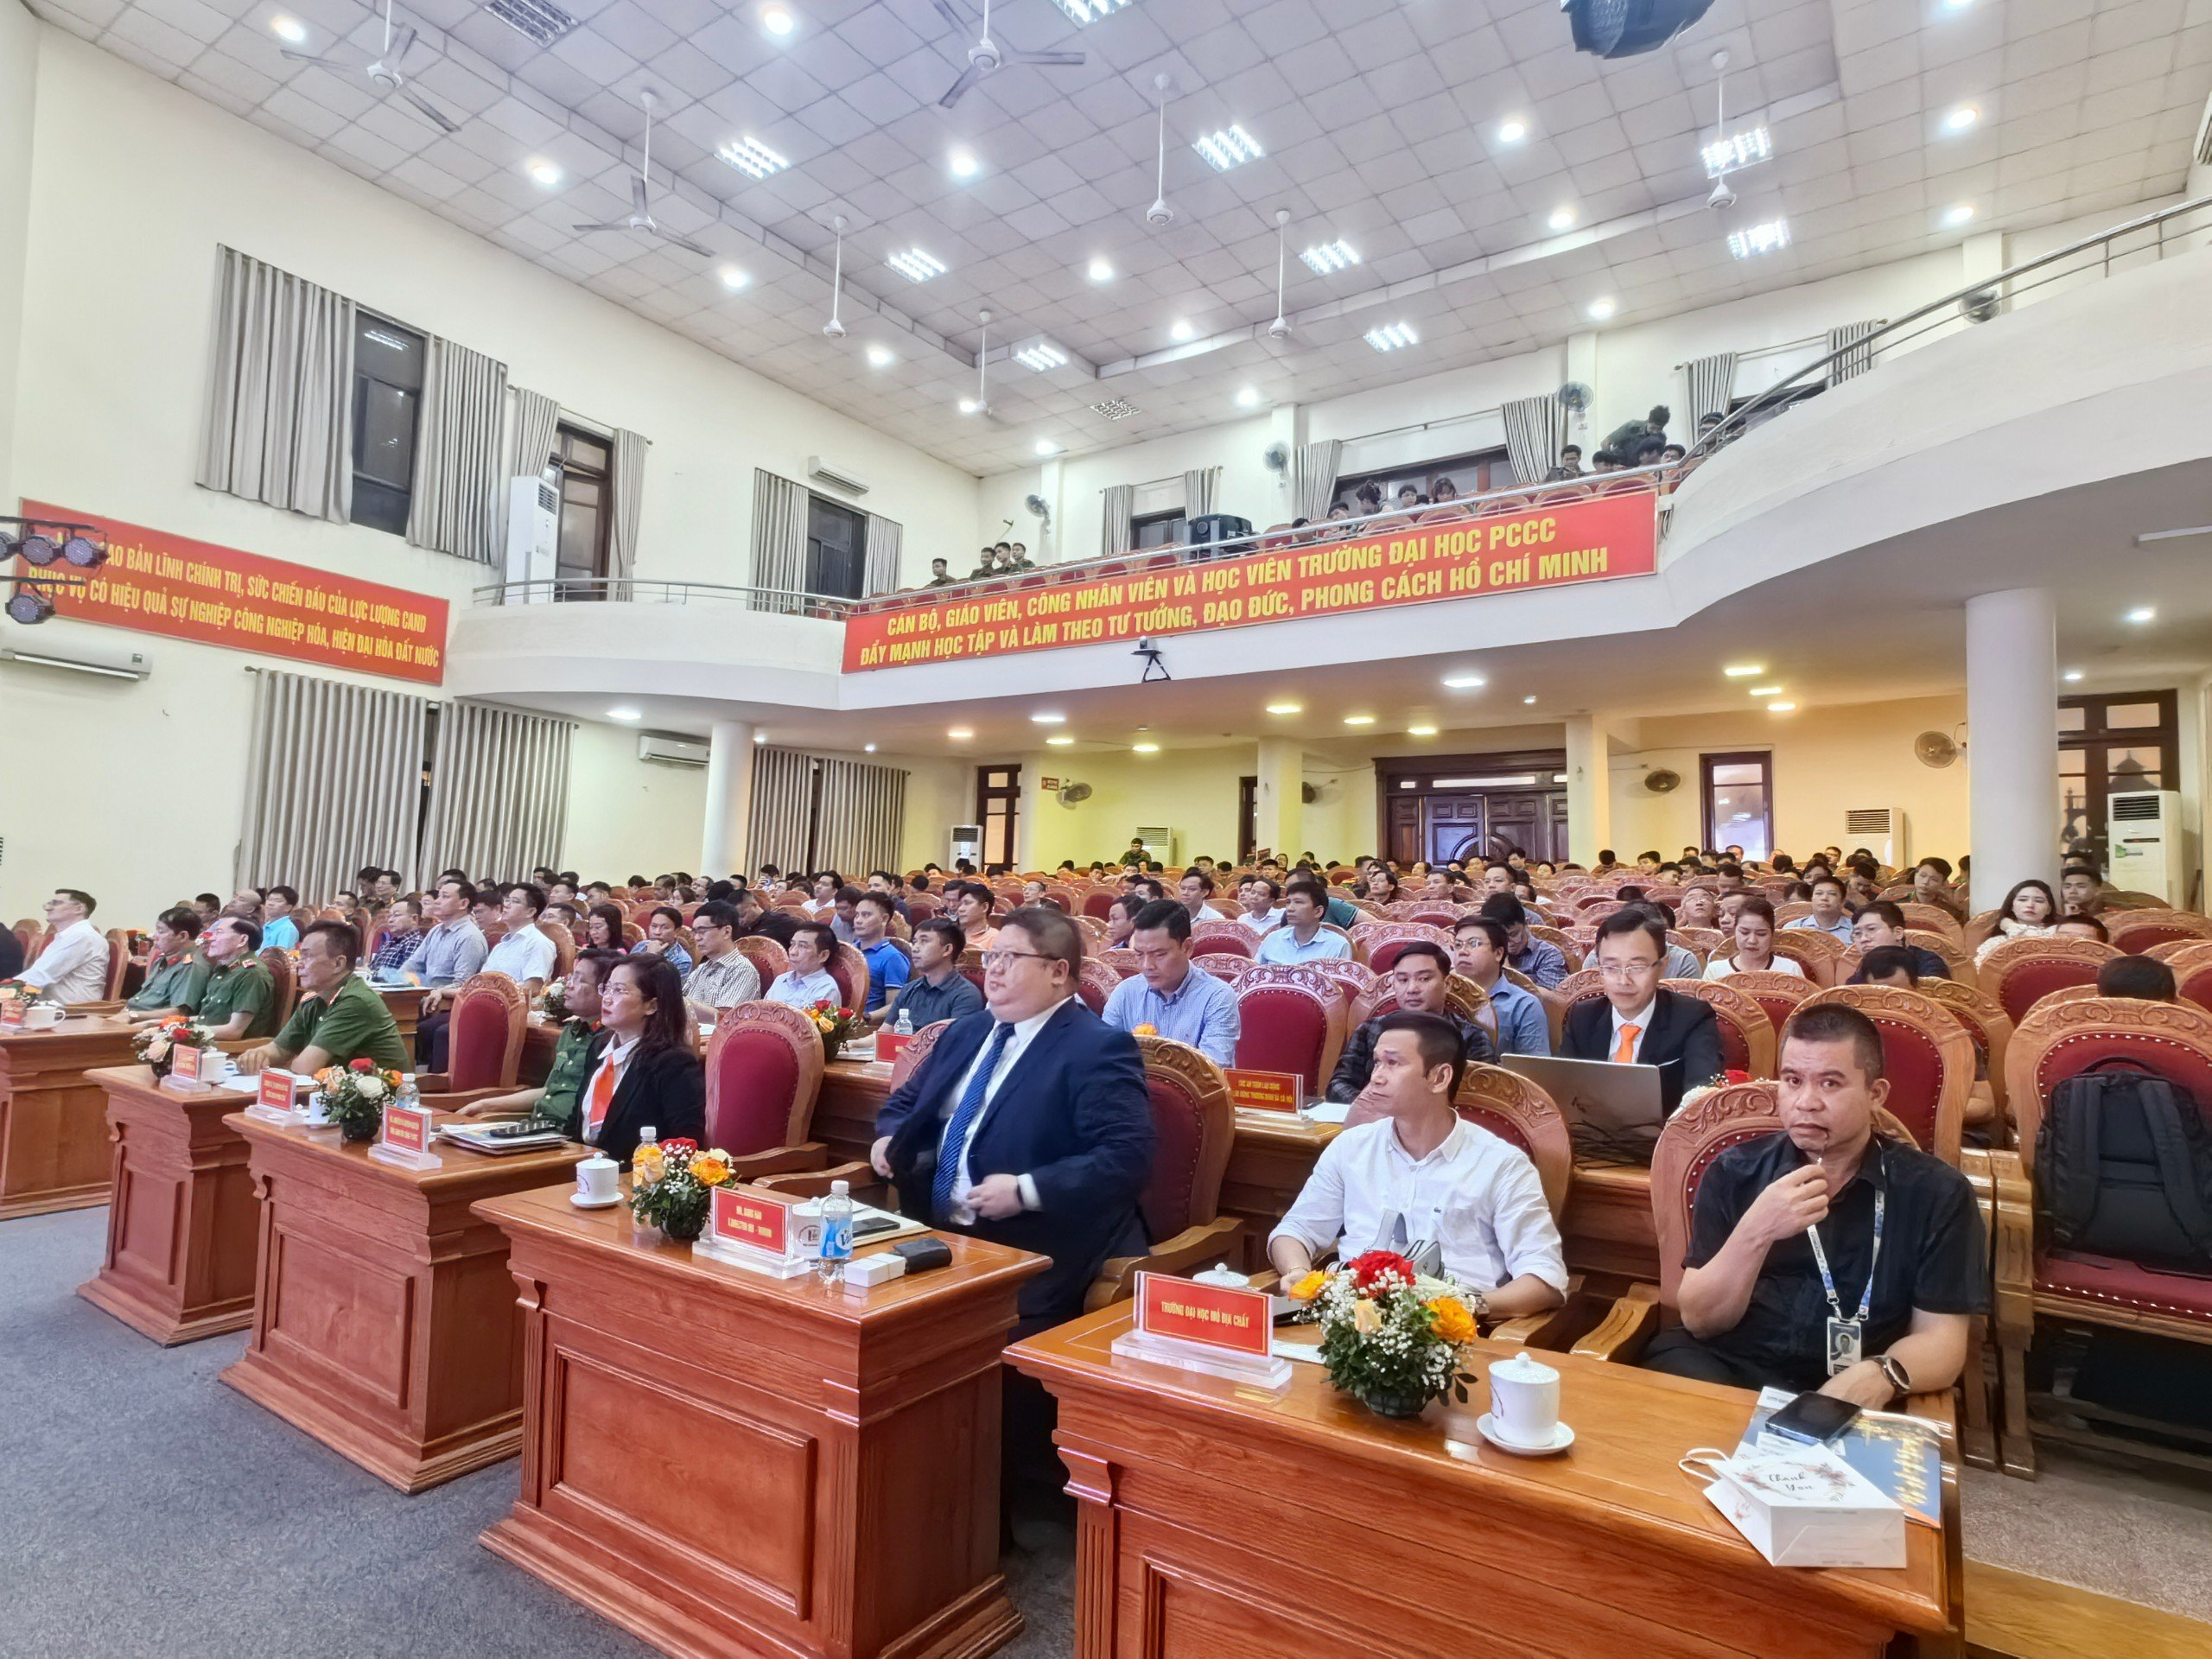
Perspective on the Conference “Explosion-Proof Electrical Equipment in Industrial and National Energy Projects”
Jun 24, 2024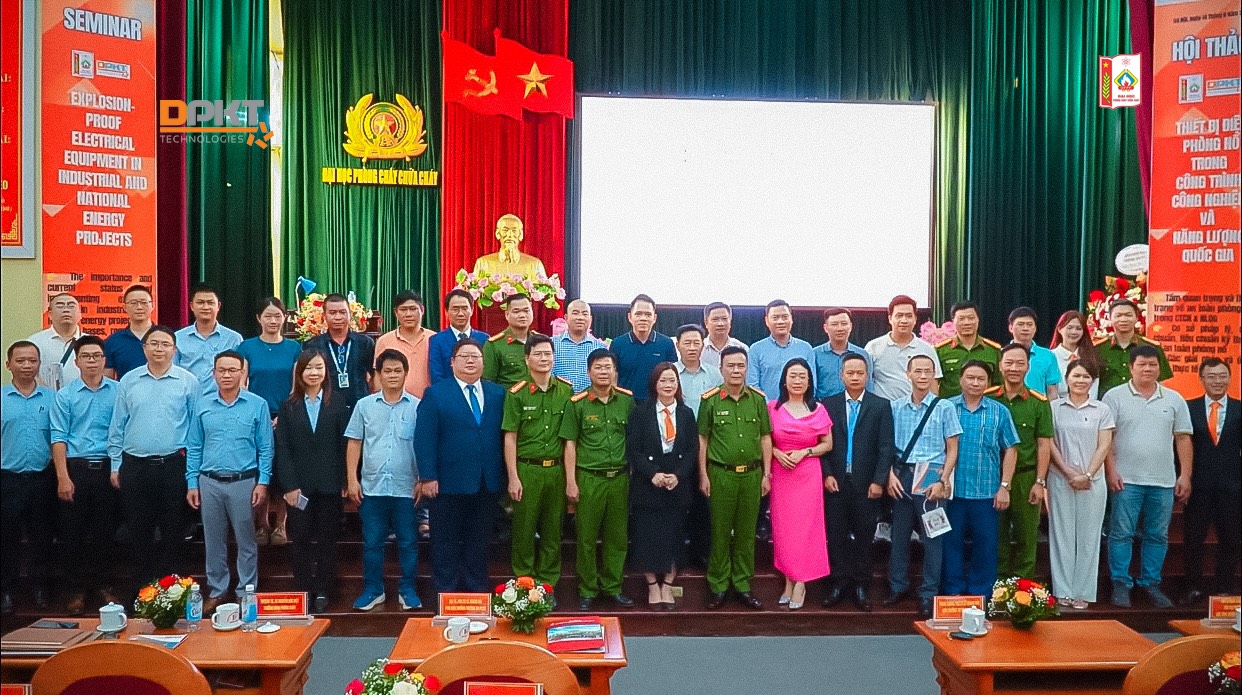
Acknowledgment for the international scientific conference “Explosion-proof Electrical Equipment in Industrial and National Energy Projects”
Jun 17, 2024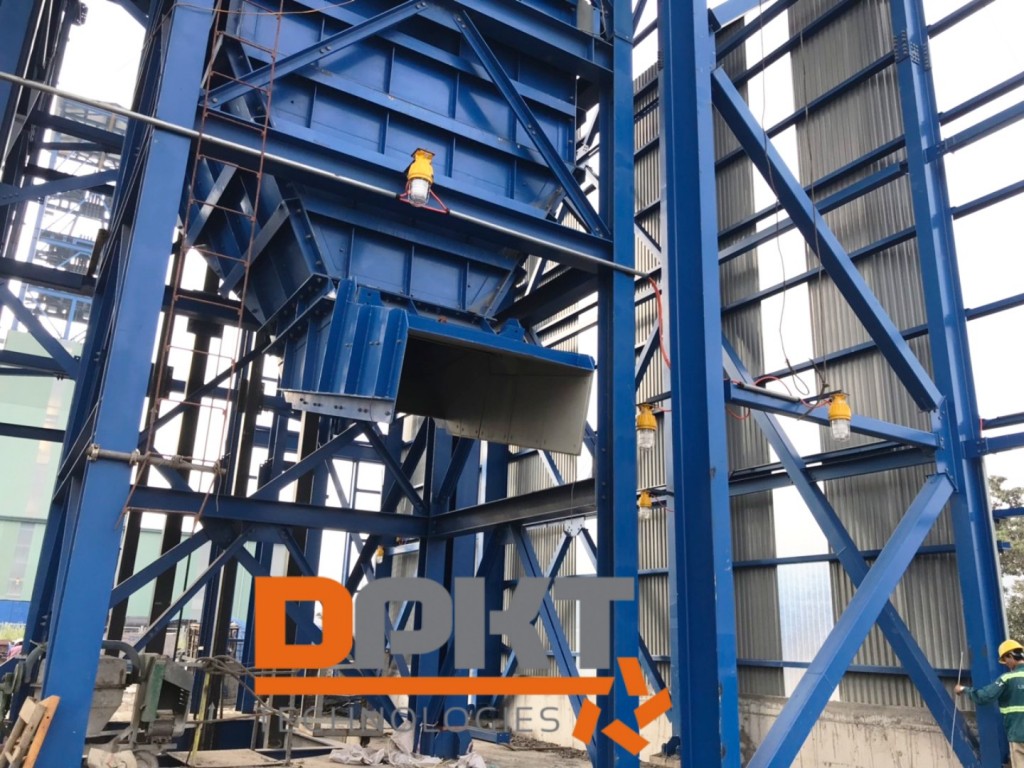
Construction site images
Nov 14, 2019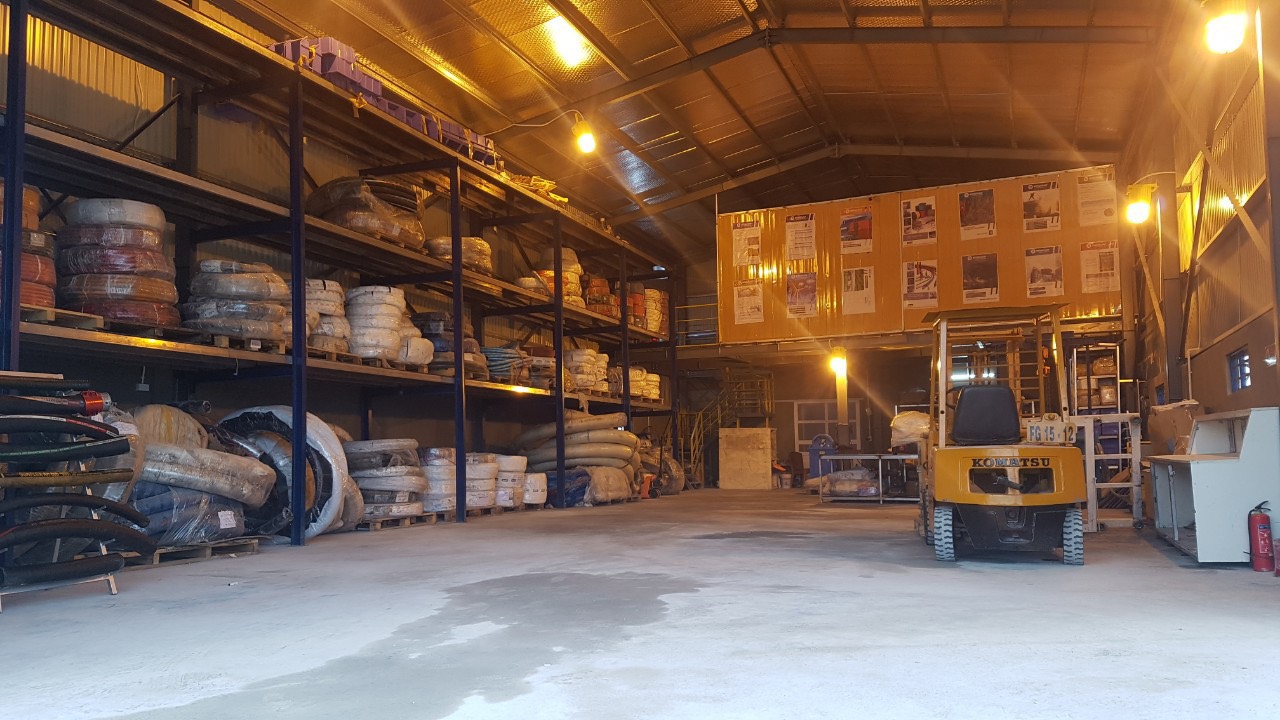
DPKT Technologies opened branch 3 in Ha Tinh
Sep 20, 2019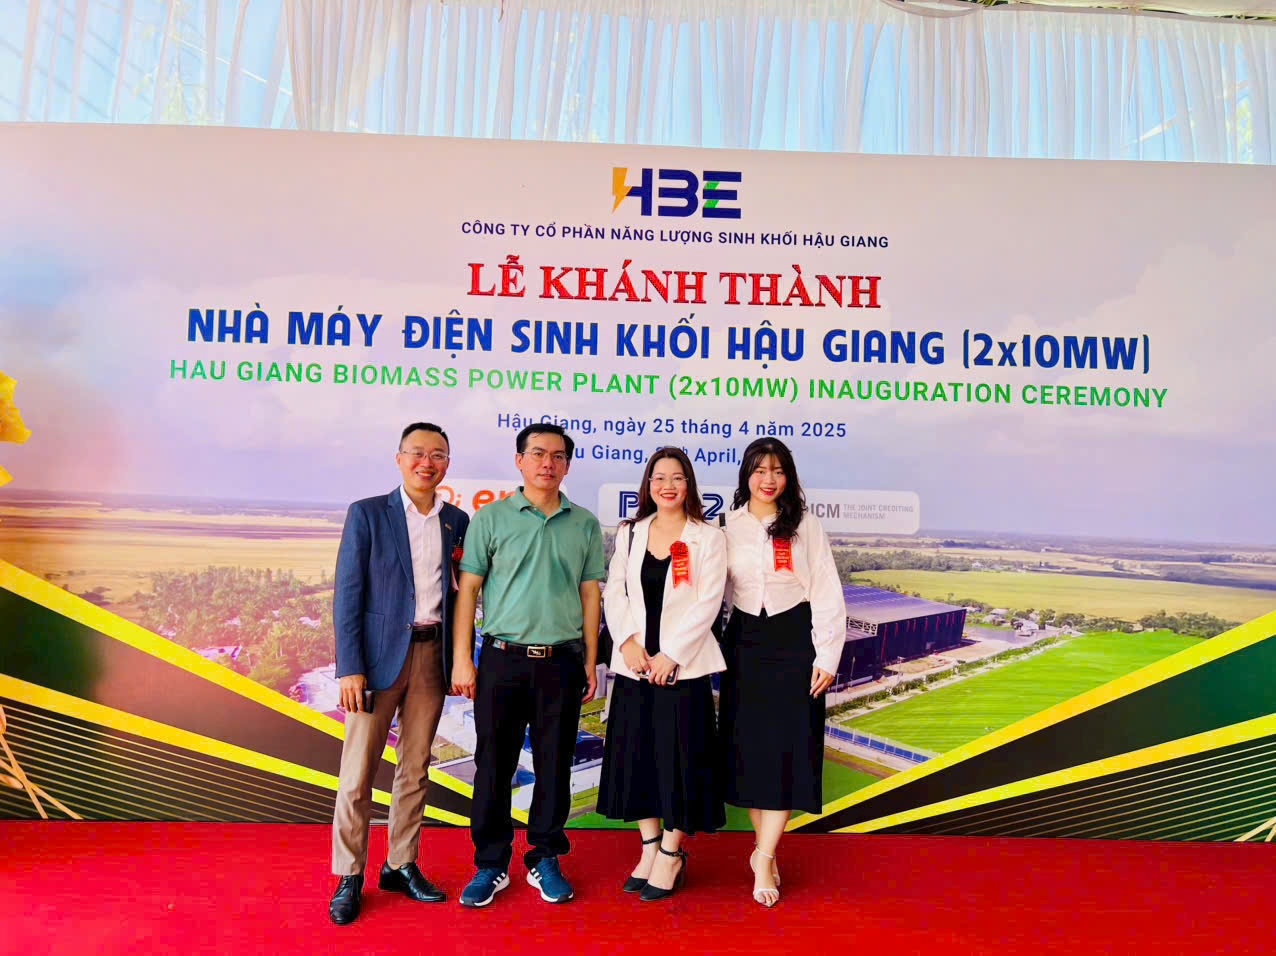
Inauguration of Hau Giang Biomass Power Plant: A Green Energy Milestone
Apr 29, 2025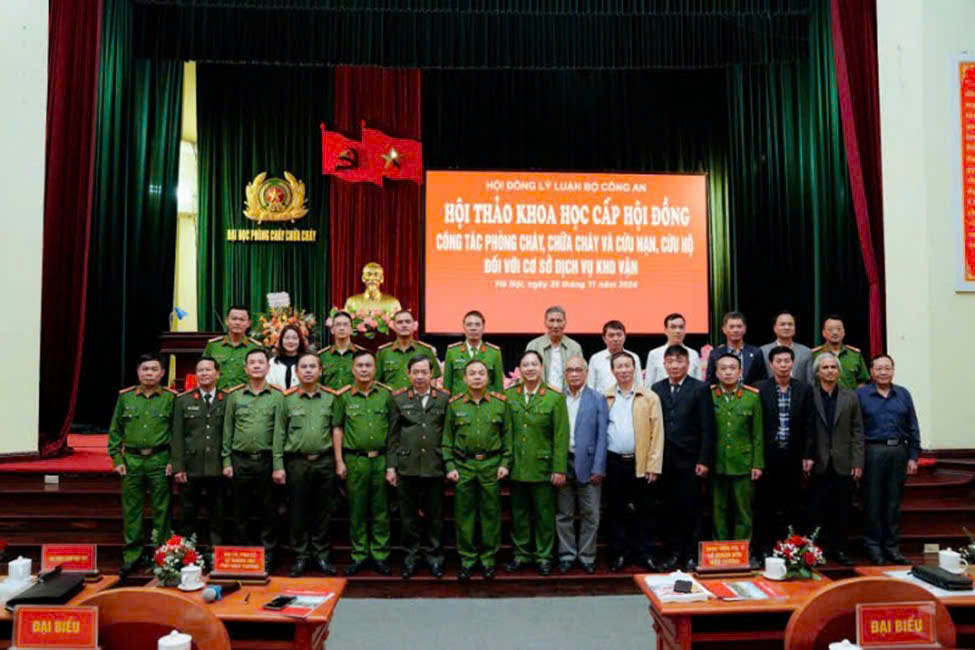
Scientific seminar on ‘Fire prevention, fire extinguishing and rescue for logistic depots’
Nov 27, 2024
DPKT TECHNOLOGIES – HOSE SOLUTION FOR OIL&GAS INDUSTRY
Sep 21, 2024
DPKT TECHNOLOGIES – SECUTECH VIETNAM 2024
Aug 22, 2024
Related posts
Inauguration of Hau Giang Biomass Power Plant: A Green Energy Milestone
In the jubilant atmosphere of celebrating the 50th anniversary of the Liberation of the South and National Reunification (April 30, 1975 – April 30, 2025), Hau Giang Biomass Energy Joint Stock Company solemnly held the inauguration ceremony of the Hau Giang Biomass Power Plant — a flagship project symbolizing the trend of sustainable and green […]
Scientific seminar on ‘Fire prevention, fire extinguishing and rescue for logistic depots’
On the afternoon of November 26th, 2024, the Ministry of Public Security and the Ministry of Public Security’s Reasoning Council held a Council-level seminar on “Fire prevention, fire extinguishing and rescue for logistic depots” at the Fire Prevention University. Authorized by the leaders of the Ministry of Public Security, Lieutenant General, Associate Professor, Dr. Le […]
DPKT TECHNOLOGIES – HOSE SOLUTION FOR OIL&GAS INDUSTRY
Recently, DPKT Technologies successfully completed an order for hydraulic pipes, fittings, and couplings for our partner PVEP. Our products are designed to serve industries such as maritime and oil & gas exploration,…ensuring international quality standards. DPKT is committed to providing the best customer experience and delivering the highest quality services. Once again, we would like […]
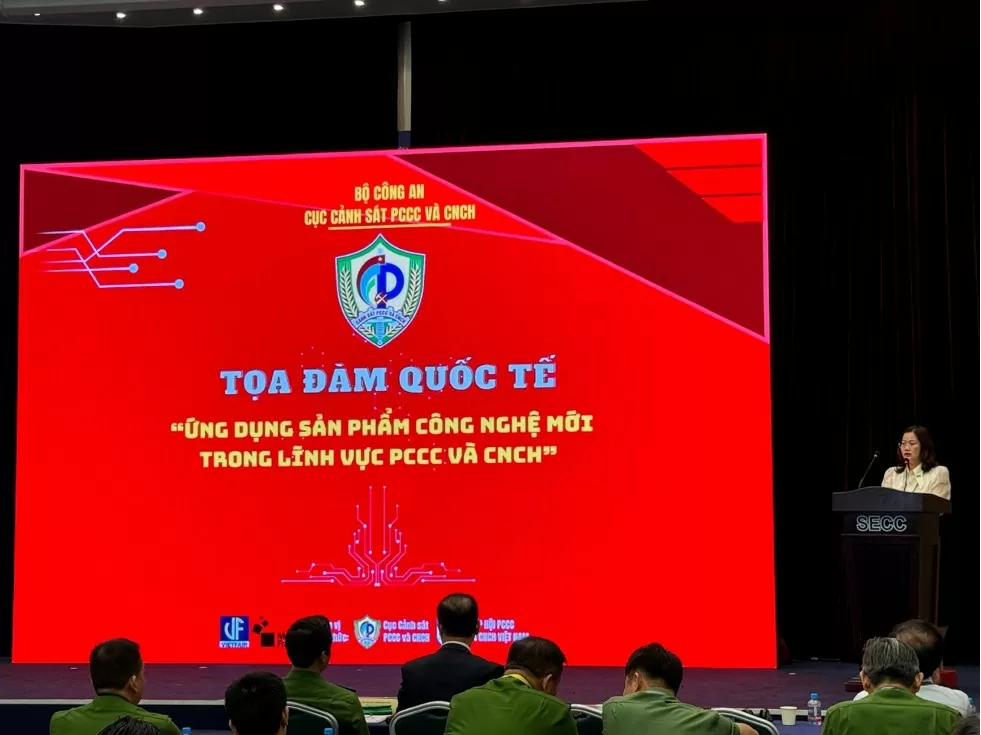
DPKT TECHNOLOGIES – SECUTECH VIETNAM 2024
📣 The SECUTECH VIETNAM 2024 International Exhibition took place from August 14-16, 2024, at the Saigon Exhibition and Convention Center (SECC) in Ho Chi Minh City. Organized by the Fire Prevention and Rescue Police Department in coordination with the Vietnam Fire Protection & Rescue Association, the event attracted over 350 businesses from 23 countries and […]
DPKT TECHNOLOGIES – Application of AI in Fire Protection
The application of AI in fire prevention and firefighting is considered a highlight at the 2024 International Exhibition on Fire Prevention and Rescue Equipment, Security, and Safety Protection. It also serves as a key focus at the international seminar on the application of new technology products in the field of fire prevention and rescue. Taking […]